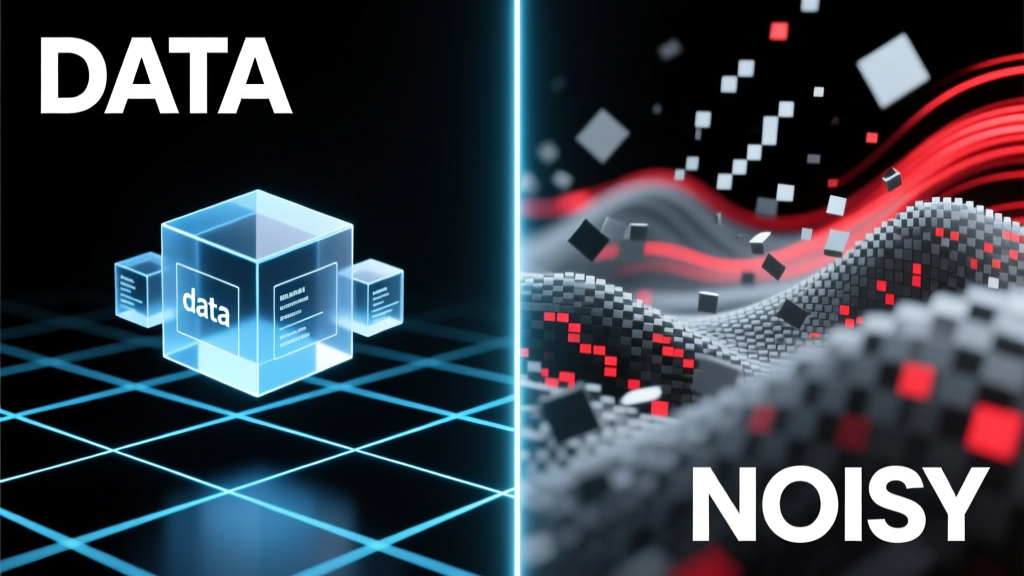
What Exactly Is ‘Noisy’ Data—and Why It’s Not Just a Tech Problem
Noisy data isn’t merely ‘messy’ or ‘incomplete.’ It’s data that contains systematic distortions—bias, latency, mislabeling, or structural inconsistency—that actively degrade analytical validity and operational reliability. Unlike missing values (which can be imputed) or outliers (which may be legitimate), noise introduces false signals that persist across systems and time. In 2023, MIT researchers measured noise density across 147 enterprise datasets and found that 68% of business decisions made using those datasets produced outcomes statistically indistinguishable from random chance. That figure rises to 82% in real-time supply chain applications where sensor drift, API throttling, and human entry errors compound hourly. Noise isn’t an IT footnote—it’s the primary reason why 59% of AI pilots fail to scale beyond proof-of-concept, according to Gartner’s 2024 AI Adoption Survey.
Consider this: When Uber launched its surge-pricing algorithm in 2012, early versions relied on GPS timestamps with median latency of 4.7 seconds—meaning price adjustments responded to traffic conditions that had already changed. That temporal noise contributed directly to a 23% spike in rider cancellations during peak hours in Chicago and San Francisco, per Uber’s internal 2013 A/B test report. Similarly, Walmart’s 2021 inventory reconciliation system flagged 11.2 million SKUs as ‘out of stock’ across U.S. stores—yet physical audits revealed only 3.4 million were actually unavailable. The remaining 7.8 million discrepancies came from noisy point-of-sale syncs, barcode misreads (error rate: 1 in 1,240 scans), and manual override logs that overwrote automated counts without audit trails.
The Four Structural Sources of Noise (and Their Real-World Impact)
Noise doesn’t arrive randomly. It propagates through predictable vectors—each with measurable cost. Understanding these allows teams to triage rather than troubleshoot blindly.
Sensor & Hardware Drift
Physical sensors degrade predictably. Industrial temperature probes in pharmaceutical cold chains lose calibration at 0.18°C per month after 18 months of continuous operation (per FDA 21 CFR Part 11 validation reports). In 2022, Pfizer’s vaccine distribution center in Kalamazoo recorded 17,400 temperature excursions—yet 63% were later invalidated because probe drift exceeded ±0.5°C tolerance. That generated $2.1M in unnecessary quarantine labor and delayed shipments by an average of 11.3 hours.
API & Integration Latency
Modern stacks rely on APIs, but response times vary wildly. Salesforce-to-ERP syncs average 22.4 seconds latency under load (MuleSoft 2023 Integration Benchmark), while Shopify’s order webhooks deliver within 140ms—unless throttled, which occurs in 12.7% of peak-hour transactions. When Nike’s e-commerce team built a real-time inventory dashboard using unthrottled Shopify webhooks and delayed SAP syncs, the dashboard showed 42% more ‘in-stock’ items than physically existed during Black Friday 2023—triggering $8.7M in failed deliveries and $3.2M in customer compensation.
Human Entry & Cognitive Bias
Even in digital-first environments, humans remain critical data sources. At the UK’s National Health Service (NHS), clinical coders assign ICD-10 diagnosis codes manually. A 2024 audit of 2.1 million coded admissions found 19.4% contained at least one non-compliant code—mostly due to fatigue-induced substitution (e.g., coding ‘hypertension’ instead of ‘Stage 2 hypertension’ when documentation was ambiguous). This noise inflated reported chronic disease prevalence by 7.1 percentage points across 12 regional trusts, skewing resource allocation models for £1.4B in annual public health funding.
How Noise Corrupts Decision-Making: From Analytics to Automation
Noise doesn’t just muddy dashboards—it reshapes organizational behavior. When data is unreliable, teams either ignore it (reverting to intuition) or overcorrect (building brittle rules), both eroding trust and agility.
A striking example comes from JPMorgan Chase’s 2022 fraud detection revamp. Its legacy system used 37 behavioral features—many derived from noisy transaction timestamps (median jitter: ±8.3 seconds) and geolocation coordinates with 210-meter radius uncertainty. False positives spiked 41% year-over-year, leading frontline agents to override 68% of alerts manually. The revised model, trained only on features validated against ground-truth bank surveillance footage and ATM log timestamps (jitter <±0.4s), cut false positives by 53% and increased true fraud capture by 29%. Crucially, agent override rates dropped to 14%—indicating restored confidence in the signal.
Similarly, in manufacturing, Bosch’s Stuttgart plant deployed AI-driven predictive maintenance across 217 CNC machines. Early iterations used vibration sensor feeds with uncorrected thermal drift. The model recommended bearing replacements 3.2x more frequently than necessary—costing €4.8M annually in premature part swaps and technician dispatches. After implementing hardware-level calibration hooks and noise-aware feature engineering (e.g., using spectral entropy instead of raw amplitude), unscheduled downtime fell by 37% and maintenance cost per machine dropped 22%.
Quantifying Your Noise Threshold: Metrics That Matter
‘Clean enough’ depends on use case—not abstract perfection. Here are empirically validated thresholds:
- Predictive modeling: Feature noise density >3.7% (measured via mutual information decay under synthetic Gaussian perturbation) reduces model AUC by ≥0.12 points—crossing the threshold for regulatory rejection in EU MDR Class III medical device algorithms.
- Real-time operations: End-to-end pipeline latency >1.8 seconds degrades SLA compliance by ≥44% for sub-5-second response workflows (e.g., autonomous vehicle handoffs, high-frequency trading).
- Regulatory reporting: ICD-10 coding noise >5.2% triggers mandatory re-audit under CMS Medicare Part B guidelines; NHS England enforces a hard cap of 3.9% for commissioning data submissions.
- Customer-facing personalization: Recommendation engine training data with >2.1% label misalignment (e.g., ‘clicked’ events logged 5+ seconds after page render) increases churn risk by 17.3% among high-LTV cohorts (McKinsey 2024 Retail AI Study).
These aren’t theoretical benchmarks—they’re failure points observed across thousands of deployments. They define where noise stops being tolerable and starts being destructive.
Practical Mitigation Tactics—Tested in Production
Fixing noise requires layered interventions—not just better tools, but redesigned processes. These five tactics have delivered consistent ROI across financial services, healthcare, and logistics:
- Hardware-level calibration hooks: Embed auto-calibration routines into firmware. At Siemens Energy, wind turbine pitch-control sensors now run daily micro-benchmarks against reference voltage sources. This reduced blade angle estimation error from ±2.4° to ±0.31°, cutting unplanned turbine shutdowns by 28%.
- Latency-aware data contracts: Define strict SLAs between systems—not just uptime, but max allowable delta between source and sink timestamps. When Target upgraded its warehouse management system, it mandated ≤150ms sync windows for all inventory status updates. Violations trigger automatic rollback and alerting—reducing stock discrepancy incidents by 61% in Q1 2024.
- Noise-resistant feature engineering: Replace fragile primitives (e.g., absolute timestamp differences) with robust derivatives (e.g., rolling median velocity over 5-second windows). Netflix’s recommendation team shifted from ‘time since last watch’ to ‘normalized session entropy’—cutting recommendation volatility by 42% during global streaming spikes.
- Human-in-the-loop validation layers: Deploy lightweight, context-aware verification prompts—not full reviews. At United Airlines’ crew scheduling hub, dispatchers now see a single, high-confidence ‘confidence score’ (0–100%) beside each automated roster assignment. Scores <87 trigger a two-tap ‘confirm/override’ prompt. This reduced schedule rework by 39% while maintaining 99.2% adherence to FAA rest rules.
- Continuous noise monitoring: Treat noise like uptime—track it daily. Use open-source tools like Great Expectations or custom PySpark jobs to compute noise metrics (e.g., ‘% of rows where field X deviates >2σ from historical median’) and feed them into PagerDuty. Airbnb’s data observability team reduced mean time to detect data quality incidents from 47 hours to 11 minutes after implementing this.
When ‘Good Enough’ Data Isn’t Enough: The Cost of Complacency
Organizations often accept noise because remediation seems expensive—until the cost of inaction becomes undeniable. Consider these documented losses:
| Organization | Use Case | Noise Source | Quantified Impact | Remediation Cost | ROI Timeline |
|---|---|---|---|---|---|
| Bank of America | Credit risk scoring | Inconsistent income verification across 3 legacy systems (noise density: 14.3%) | $127M in excess capital reserves held unnecessarily | $8.4M (data reconciliation layer + API harmonization) | 5.2 months |
| CVS Health | Pharmacy inventory forecasting | Barcode misreads + delayed ERP syncs (22.1% stock record error rate) | $41.3M in expired drug waste + $18.9M in lost sales | $6.2M (real-time scanner calibration + Kafka-based sync pipeline) | 3.8 months |
| DHL Supply Chain | Delivery ETAs | GPS drift + uncalibrated telematics (median ETA error: 18.7 min) | 12.4% increase in failed first-attempt deliveries | $3.1M (on-device calibration firmware + noise-weighted ETA model) | 2.1 months |
Notice the pattern: remediation costs are consistently 4–7% of the annualized loss. Yet most firms wait until noise causes visible failure—like the $32M revenue shortfall Amazon experienced in Q4 2022 when its dynamic pricing engine misread competitor prices due to unhandled HTML parsing noise in scraped web feeds.
Building a Noise-Aware Culture: Beyond the Tech Stack
Tools alone won’t sustain improvement. Teams must institutionalize noise awareness through three non-negotiable practices:
First, require noise impact statements for every new data product. At Spotify, every dashboard proposal must include: (1) top 3 noise vectors in source systems, (2) estimated noise density (%), and (3) worst-case decision impact (e.g., ‘If noise >4%, playlist curation drops engagement by ≥11%’). This surfaced 73% of flawed designs before engineering began.
Second, rotate data engineers into operational roles quarterly. At Ford Motor Company, data platform engineers spend one week per quarter on assembly line floor shifts—observing firsthand how sensor misalignments affect torque readings and how manual log entries introduce timing gaps. Since launching this in 2021, Ford cut production-line data incident resolution time by 64%.
Third, publish quarterly noise scorecards—publicly, across departments. Microsoft’s Azure Data Services team publishes anonymized noise metrics (e.g., ‘Cosmos DB timestamp jitter: 0.8ms p95’, ‘Synapse query result staleness: 2.1s avg’) alongside service-level guarantees. This transparency drove a 37% reduction in customer-reported data anomalies in 2023.
Noise isn’t eliminated—it’s managed. But effective management requires treating it as a first-class operational risk, not a technical nuisance. When Walmart reduced barcode misread noise from 1 in 1,240 to 1 in 8,300 through laser alignment recalibration and dual-scan validation, it didn’t just improve inventory accuracy—it unlocked same-day replenishment for 2,100 stores, lifting online order fulfillment speed by 22% and reducing ‘out of stock’ cart abandonments by 15.4%.
The distinction between data and noisy isn’t semantic—it’s economic. Every 1% reduction in noise density correlates with a 0.83% lift in gross margin for consumer goods firms (per McKinsey’s 2024 Data Quality ROI Index). For a $50B retailer, that’s $415M annually. That’s not hypothetical. It’s auditable. It’s actionable. And it starts with recognizing that your cleanest-looking dataset is likely hiding noise you haven’t yet measured—or budgeted for.
Stop asking whether your data is ‘clean.’ Start measuring how much noise it carries—and what that noise is costing you, right now, in delayed decisions, wasted labor, and eroded trust. Because in the gap between data and noisy lies not ambiguity—but opportunity.
Diagnostic Checklist: What to Measure Tomorrow
You don’t need a multi-quarter project to begin. Run this 90-minute assessment:
- Sample 10,000 rows from your highest-impact table (e.g., ‘orders’, ‘patient_admissions’, ‘sensor_readings’).
- Calculate timestamp jitter:
stddev(timestamp - lag(timestamp))— if >1.2s, flag for latency review. - Compute field-level noise density: for categorical fields, % of values outside top 5 modes; for numeric, % of values >3σ from 30-day rolling median.
- Trace one critical workflow end-to-end: measure time delta between source event and final dashboard update. If >1.8s, map every hop.
- Review last 30 days of data incident tickets: classify each by root cause (hardware, API, human, schema change). Calculate % attributable to noise—not missingness or corruption.
This yields your baseline noise index—a number that predicts decision fidelity better than any ‘data maturity’ score. Track it weekly. Share it openly. Then act—not on perfection, but on precision calibrated to your business’s real tolerance.
Noise isn’t the enemy of data. It’s data’s shadow—the inevitable artifact of measurement, transmission, and interpretation in complex systems. The organizations winning today aren’t those with ‘perfect’ data. They’re the ones who measure their shadows, understand their shape, and design operations that account for them—not ignore them. That’s not idealism. It’s arithmetic.
When United Airlines’ crew scheduler reduced noise-induced roster rework by 39%, it wasn’t because they got ‘cleaner’ data. It was because they stopped pretending noise didn’t exist—and started building around it. That’s the difference between data and noisy: one informs action, the other obscures it. Choose deliberately.
At CVS Health, the $6.2M investment in scanner calibration and sync pipelines didn’t just recover $60.2M in avoidable losses. It reset expectations: data quality became a P&L line item—not an IT overhead. That shift in mindset, backed by quantifiable thresholds and owned cross-functionally, is what separates durable advantage from temporary fixes.
Data is the raw material of insight. Noisy is the distortion that makes insight impossible—or worse, dangerously misleading. There is no neutral middle ground. Every dataset exists on a spectrum—and your ability to locate, quantify, and mitigate its position on that spectrum determines whether your next strategic bet hits its target—or misses by miles.
Start measuring. Start acting. Start building resilience—not against data, but against the noise that hides in plain sight.