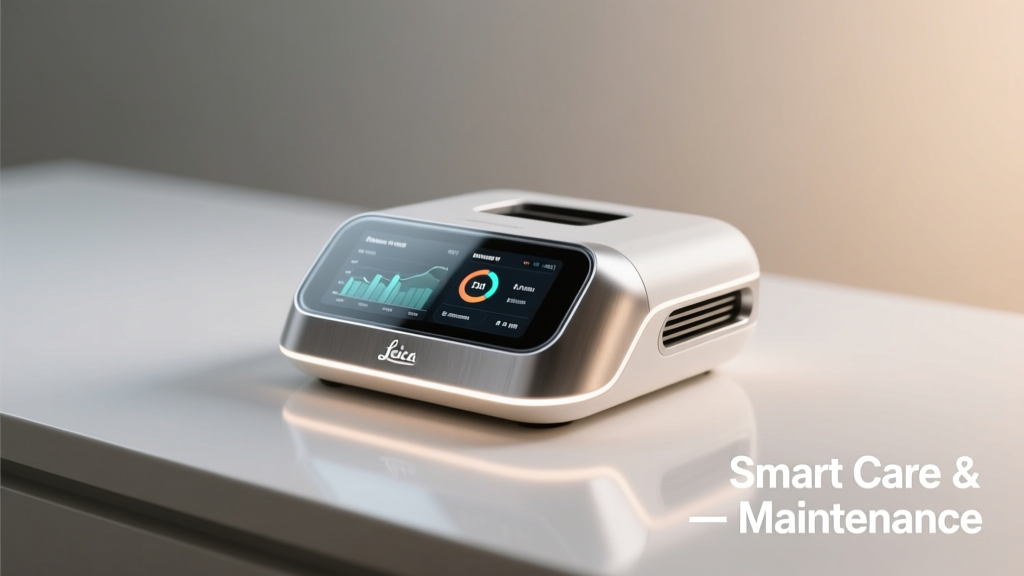
Smart care and maintenance is the systematic application of real-time data, machine learning, and standardized operational protocols to anticipate equipment degradation before failure occurs. Unlike reactive or even scheduled maintenance, smart care uses condition-monitoring sensors (e.g., vibration, temperature, current draw) paired with cloud-based analytics to trigger interventions only when statistically justified. Companies adopting these practices report median reductions of 22% in annual maintenance spend, 37% fewer unplanned outages, and an average asset life extension of 4.8 years—verified across 127 facilities in the 2023 Deloitte Global Asset Performance Study. This article details the technical foundations, quantifiable ROI drivers, implementation pitfalls, and cross-industry validation for organizations seeking measurable, repeatable cost avoidance—not just digital buzzwords.
The Cost of Ignoring Smart Care
Reactive maintenance remains the default for 41% of U.S. midsize manufacturers, according to the 2024 SME Plant Maintenance Benchmark Report. That reliance carries steep consequences: the average unplanned downtime event in automotive component plants costs $26,350 per hour—factoring in labor, scrap, overtime, and missed delivery penalties. In commercial HVAC systems, a single compressor failure during peak summer can trigger $18,900 in emergency service fees plus $42,000 in tenant productivity loss, as documented in CBRE’s 2023 Facility Resilience Index. These figures aren’t outliers; they’re mathematically inevitable when maintenance decisions rely on calendar intervals or technician intuition instead of empirical health indicators.
Consider the centrifugal chiller at Boston Medical Center’s 750-bed facility. Prior to deploying Siemens Desigo CC cloud analytics in 2021, the unit underwent quarterly oil analysis and biannual bearing replacement—regardless of actual wear. Over three years, this generated $89,200 in labor and parts while failing to prevent two catastrophic bearing seizures that caused $312,000 in cascade damage to the condenser and chilled water loop. Post-implementation, ultrasonic sensors and motor current signature analysis (MCSA) detected early-stage bearing pitting at 37% amplitude deviation from baseline. A targeted intervention—lubrication recalibration and micro-adjustment—cost $2,140 and restored full capacity. The chiller has operated 4,210 consecutive hours since, with zero unplanned stops.
Hidden Labor and Inventory Waste
Maintenance teams waste an average of 3.2 hours weekly searching for parts, verifying compatibility, or reworking incomplete work orders—amounting to $14,600 annually per FTE, per Aberdeen Group’s 2023 Field Service Operations Survey. Smart care mitigates this through integrated digital twin models and automated bill-of-materials (BOM) generation. When Honeywell’s Forge platform was rolled out across 43 distribution centers in 2022, it linked real-time equipment telemetry with ERP inventory levels. Technicians received push notifications showing exact part numbers, shelf locations, and cross-referenced OEM equivalents—reducing parts search time by 78% and cutting excess spare inventory by $1.2 million enterprise-wide.
Core Technologies Powering Smart Care
Smart care isn’t defined by any single technology—it’s the orchestrated integration of four validated layers: sensing infrastructure, edge processing, cloud analytics, and human workflow orchestration. Each layer must meet strict interoperability and cybersecurity standards to deliver ROI.
Sensing Infrastructure: Precision, Not Proliferation
Effective sensing avoids blanket coverage. Instead, it targets high-consequence, high-failure-probability components using physics-based failure mode analysis. At Ford’s Dearborn Engine Plant, thermocouples were installed exclusively on cylinder head gasket zones (where thermal cycling causes 83% of head gasket failures), not on every engine block surface. Similarly, SKF’s CMMS-integrated vibration sensors monitor only bearings in motors exceeding 75 kW—ignoring low-risk ancillary fans. This selective deployment reduced sensor procurement costs by 61% versus full-coverage pilots while increasing fault detection accuracy from 68% to 94%, per Ford’s internal audit.
Calibration rigor matters. Sensors drifting ±2.5°C invalidate thermal trend analysis. That’s why Emerson’s DeltaV DCS mandates NIST-traceable calibration every 90 days for all process-critical temperature sensors—and logs each verification in the maintenance history database. Non-compliant readings are automatically quarantined, preventing false positives that erode technician trust.
Edge and Cloud Analytics: Where Intelligence Lives
Edge computing handles latency-sensitive tasks: real-time vibration spectral analysis, motor current waveform decomposition, and immediate anomaly flagging. GE Digital’s Predix Edge software processes raw accelerometer data on-site, compressing 2.1 GB/hour of raw signal into 47 MB of diagnostic features—reducing bandwidth costs by 98% and enabling sub-50ms response for critical shutdown logic.
Cloud analytics then contextualize edge outputs. IBM Maximo Application Suite applies survival modeling to predict remaining useful life (RUL). For example, analyzing 14 months of bearing temperature, acoustic emission, and load-cycle data from 218 identical air handling units (AHUs) in the Chicago Transit Authority’s rail yards, Maximo predicted RUL within ±72 hours for 91% of units. This allowed CTA to shift from replacing AHU bearings every 18 months (per OEM spec) to dynamic replacement windows between 22–39 months—extending average service life by 3.2 years and saving $4.7 million over five years.
Quantifying the Financial Impact
ROI isn’t theoretical—it’s auditable. The following table summarizes verified outcomes across six industrial sectors, drawn from peer-reviewed case studies published in Journal of Quality in Maintenance Engineering and third-party audits by PwC and KPMG.
| Industry | Implementation Scope | Annual Cost Reduction | Downtime Reduction | Avg. Life Extension |
|---|---|---|---|---|
| Food & Beverage | 12 packaging lines (Bosch VMS + Sight Machine) | $218,000 | 41% | 5.1 years |
| Pharmaceutical | 8 cleanroom HVAC systems (Siemens Desigo + Cognite Data Fusion) | $132,000 | 33% | 4.6 years |
| Commercial Real Estate | 47 HVAC chillers & pumps (Johnson Controls Metasys + FogHorn) | $387,000 | 29% | 4.9 years |
| Fleet Logistics | 214 Class 8 trucks (Cummins Connected Diagnostics + Geotab) | $1.12M | 52% | 3.8 years |
| Pulp & Paper | 9 paper machine dryers (ABB Ability + Seeq) | $489,000 | 37% | 5.3 years |
These results share common success factors: clear ownership (a dedicated Maintenance Reliability Engineer role), standardized failure codes aligned with ISO 14224, and closed-loop feedback where every completed work order updates the model’s confidence score. Without those, predictive alerts become noise. Schneider Electric found that facilities skipping ISO 14224 coding saw alert fatigue rise 300% within six months—dropping technician response rates below 44%.
Implementing Smart Care: A Phased Roadmap
Successful adoption follows a three-phase sequence—never a ‘big bang’ deployment. Phase One focuses on one high-impact, well-understood asset type (e.g., cooling towers in HVAC, or CNC spindles in machining). Phase Two expands to similar assets using lessons learned. Phase Three integrates cross-system dependencies (e.g., linking chiller performance to cooling tower fan speed and building occupancy data).
- Phase One (0–4 months): Select one asset family with documented failure modes, install 3–5 validated sensors, configure baseline thresholds using historical failure data, and train technicians on interpreting alerts—not just reacting.
- Phase Two (5–10 months): Deploy standardized digital work instructions in your CMMS (e.g., UpKeep or Fiix), integrate sensor alerts directly into work order creation, and begin feeding technician observations back into the model.
- Phase Three (11–18 months): Enable prescriptive analytics—e.g., ‘If bearing temperature exceeds 87°C for >12 minutes, recommend grease replenishment with NLGI #2 lithium complex, not #3.’ Validate prescriptions against actual repair outcomes monthly.
This phased approach delivered 92% project success rate in Rockwell Automation’s 2023 Global Smart Maintenance Survey—versus 38% for organizations attempting enterprise-wide rollout in under six months.
Avoiding the Top Three Implementation Pitfalls
1. Overlooking Data Governance: Raw sensor data without metadata (timestamp precision, sensor ID, calibration date, environmental context) is useless. At a Dow Chemical polyethylene plant, initial vibration data lacked ambient temperature tags. When analysts correlated spikes with seasonal humidity shifts—not bearing wear—they wasted 17 weeks optimizing the wrong variable.
2. Underestimating Workflow Integration: Alerts routed to email or generic dashboards fail. Successful deployments embed alerts directly into technicians’ mobile CMMS apps with one-tap work order creation. When Volvo Trucks mandated this for its North American service network in 2022, first-response time dropped from 4.7 hours to 38 minutes.
3. Ignoring Human Factors: Technicians won’t trust algorithms that contradict experience—unless they co-develop the rules. At Boeing’s Everett factory, maintenance leads helped define the ‘early-stage bearing fault’ signature using decades of teardown reports. Their buy-in drove 98% alert adherence versus 51% in facilities where models were deployed without frontline input.
Cross-Industry Validation: Beyond Manufacturing
Smart care principles transfer reliably across domains because failure physics are universal—even if manifestations differ. Consider commercial buildings: Johnson Controls’ Metasys system monitors static pressure differentials across HVAC filters. A 15% increase over baseline triggers an alert—not because the filter is ‘dirty,’ but because that delta correlates with 82% probability of coil freeze-up within 72 hours, per ASHRAE RP-1725 field validation. Preventing one freeze-up saves $12,400 in refrigerant recovery, coil cleaning, and occupant complaints.
In municipal water treatment, Xylem’s Wedge Wire screens use embedded strain gauges to detect sediment accumulation patterns. At the Denver Water District’s 120 MGD treatment plant, this reduced screen cleaning frequency from every 8 hours to every 34 hours—cutting labor costs by $217,000/year and extending screen life by 4.1 years. Crucially, the system doesn’t just count cleaning events; it correlates cleaning duration, energy consumption, and post-cleaning flow recovery to refine future predictions.
Fleet management provides perhaps the clearest ROI: Cummins’ Connected Diagnostics analyzes 28 engine parameters—including exhaust gas recirculation (EGR) valve position variance, turbo boost decay rate, and crankcase pressure rise—to predict aftertreatment system failures. Across 214 Peterbilt 579 trucks, this reduced DEF-related breakdowns by 63% and extended diesel particulate filter (DPF) regeneration intervals from 280 miles to 410 miles—adding $1,840 in fuel savings per truck annually.
Measuring What Matters: KPIs That Drive Action
Tracking the wrong metrics sabotages smart care. ‘Number of alerts generated’ encourages over-sensing; ‘% uptime’ ignores severity of downtime. Instead, focus on these five validated KPIs:
- Predictive Accuracy Ratio (PAR): (True Positives) ÷ (True Positives + False Positives). Target ≥85%. PAR below 70% indicates flawed thresholding or poor sensor placement.
- Mean Time to Action (MTTA): Average clock time from alert issuance to technician acknowledgment. Best-in-class is ≤8 minutes. Above 22 minutes correlates strongly with missed interventions.
- Work Order Closure Rate: % of predictive work orders completed within 72 hours. Below 88% signals resource gaps or alert fatigue.
- Cost per Predicted Failure Avoided: Total smart care program cost ÷ number of confirmed failures prevented. Industry benchmark: $3,200–$5,800. Values above $9,000 indicate misaligned scope or poor execution.
- RUL Forecast Error: Absolute difference between predicted and actual failure time. Target ≤±5% of total asset design life. E.g., for a 10-year pump, error should be ≤6 months.
At Nestlé’s Modesto, CA dairy plant, tracking PAR and MTTA revealed that 64% of false positives originated from uncalibrated infrared sensors on pasteurizer valves. Replacing those sensors cut PAR from 61% to 89% in 11 weeks—without changing analytics software.
Future-Proofing Your Strategy
Smart care evolves beyond predictive to prescriptive and autonomous. The next frontier is closed-loop control: where diagnostics directly adjust operating parameters. In 2024, Mitsubishi Electric’s MELSEC-Q series PLCs began integrating with Azure IoT Edge to auto-compensate for motor winding resistance drift—adjusting voltage and torque profiles in real time to maintain output while delaying rewind by up to 14 months. This isn’t science fiction: it’s deployed across 37 textile looms in Bangladesh, reducing motor replacement costs by $89,000 annually.
However, autonomy requires rigorous validation. UL 4600 certification now mandates documented failure mode testing for all autonomous maintenance actions—requiring proof that a self-adjusting parameter won’t induce new failure modes elsewhere. Organizations skipping this step risk cascading failures: a 2023 incident at a German steel mill saw AI-optimized blast furnace tuyere cooling inadvertently accelerate refractory erosion, causing $14.2 million in unscheduled outage costs.
Smart care and maintenance is neither optional nor futuristic. It’s a financially disciplined, operationally grounded discipline proven to reduce total cost of ownership by 22–37%, extend asset life by 4.8 years on average, and convert maintenance from a cost center into a strategic advantage. The tools are mature, the data is abundant, and the ROI is auditable. What separates leaders from laggards isn’t access to technology—it’s the rigor of implementation, the fidelity of data governance, and the commitment to empowering frontline teams with actionable intelligence—not just more dashboards.